Trends in tropical storm peak winds PACIFIC
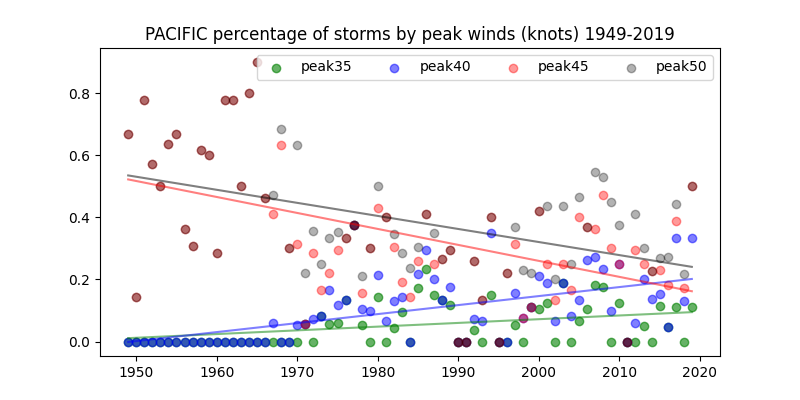
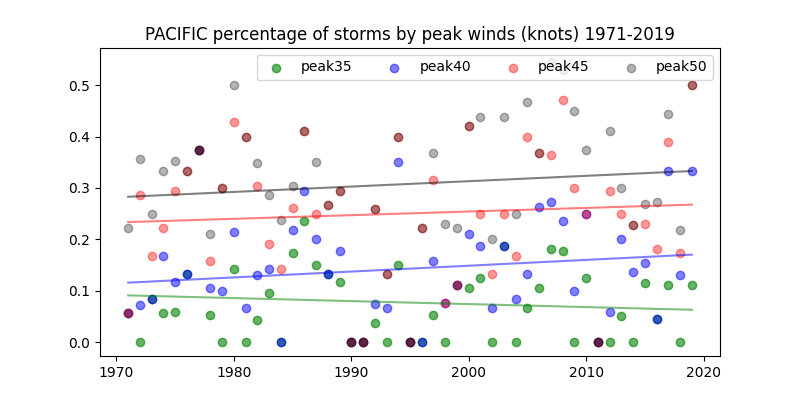
These plots show the percentages of tropical storms with peak winds
<= 50 knots, <= 45 knots, <= 40 knots and <= 35 knots. In each year
the total number of storms is counted and the storms in each category
are counted. The counts are inclusive, i.e. the count of peak <= 50
knots includes the storms with peak <= 45 knots, etc. Then the counts
in each category are divided by the total storms and hurricanes for
the year. Post-tropical winds are ignored. Storms that fail to
achieve tropical storm criteria (>= 35 knots) are ignored.
PACIFIC The trend since 1971 seems to indicate consistent detection methodology. The data from 1949 to 1970 has a completely different methodology. Also the gray dots cover up the red dots in the plot and turn into darker dots, but it shows coarser quantization of wind speeds.
Goto ATLANTIC
Code: tropicalstorms-pac.py | Data: hurdat2-nepac.csv | Instructions: README.tropicalstorms
|
|