https://www.ngdc.noaa.gov/mgg/topo/globe.html
https://www.ngdc.noaa.gov/mgg/topo/report/globedocumentationmanual.pdf
Elevation Code: elevations.py
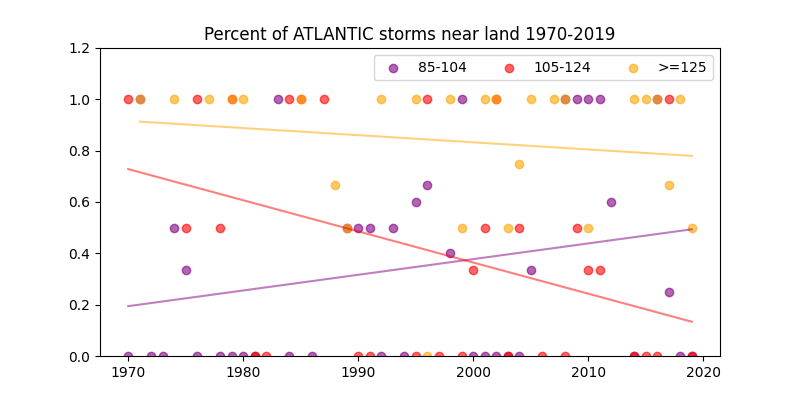
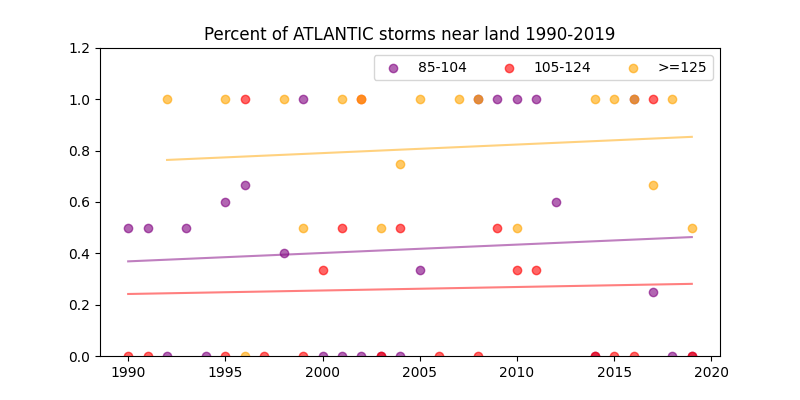
These plots show the percentage of storms that travel near land at any point in their lifetime. Use of the GLOBE data rather than the Landfall column in the HURDAT database identifies a large number storms that travel near land but are not noted as making landfall in the normal 6 hour reports. Many of those storms in fact make landfall in intermediate reports. However intermediate reports are not consistent through history.
The total number of storms is counted for each year and the fastest 24 wind increase is tracked for each storm. The storms in each peak wind category are counted. Storm coordinates are checked every six hours against the GLOBE database to see if the storm is near land.
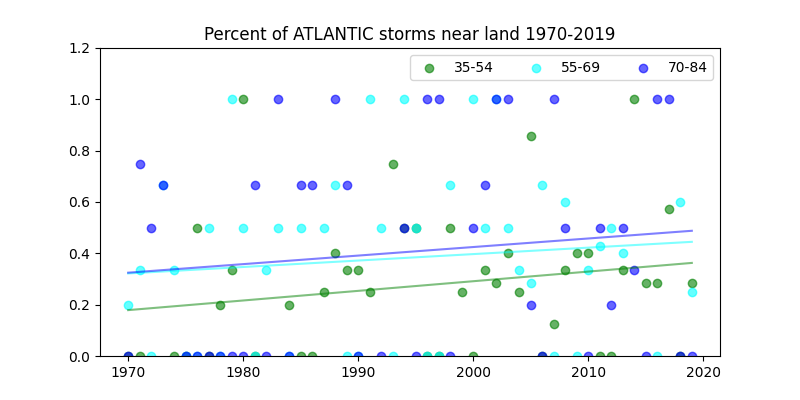
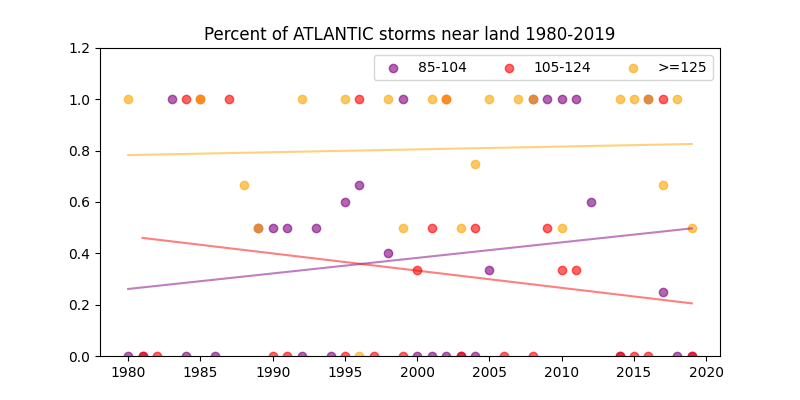
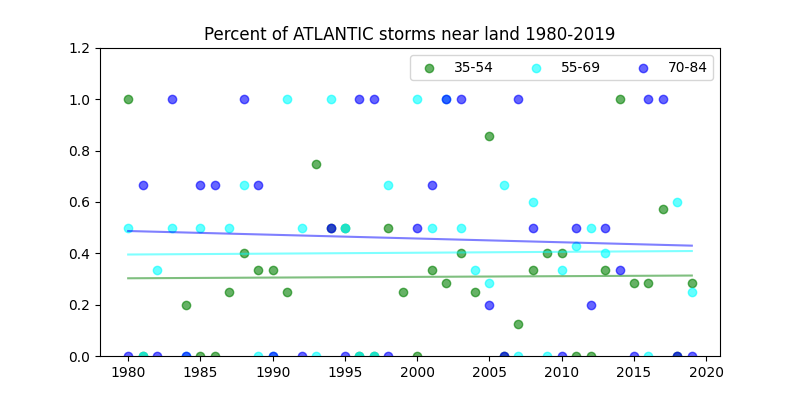
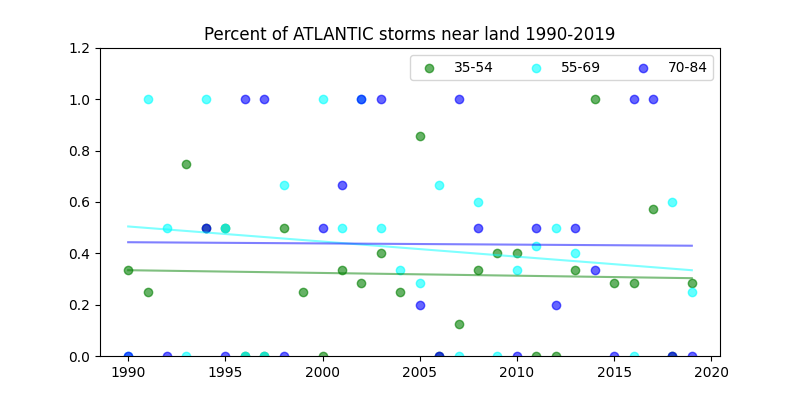
The storms travel that near land in each peak wind category divided by the total storms in each peak wind category for the year. Post-tropical winds are ignored. Storms that fail to achieve tropical storm criteria (>= 35 knots) are ignored. If there are zero storms in any category for any year there is no point in the scatterplot or in the linear trend calculation.
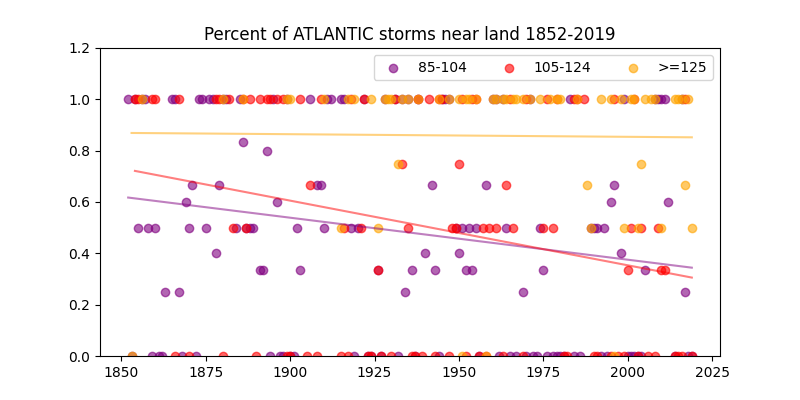
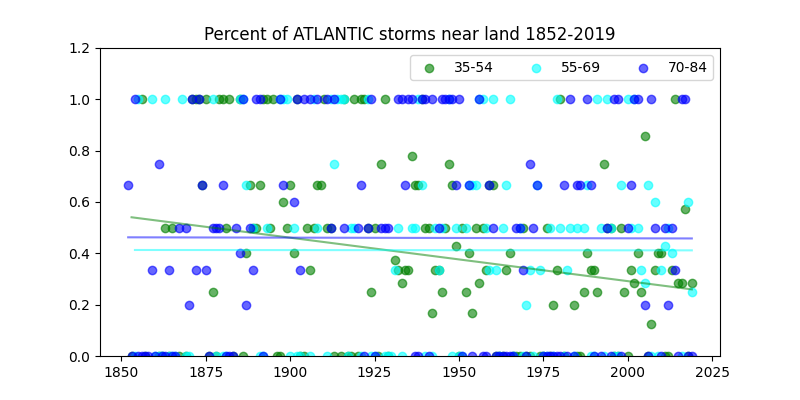
An annual point of 0.0 means all storms in that category were "fish storms" i.e. storms that never went near land. An annual point of 1.0 means all storms in that category went near land at some point in their lifetime. A line sloping down means an increasing percentage of fish storms. A line sloping up means a decreasing percentage of fish storms.
The record since 1970 shows inconsistent detection and recording. There is an decreasing percentage of fish storms in the weak categories and inconsistent percentages in the strong categories except for the strongest storm category >= 125 knots. That means there has been consistent detection and recording of the strongest storms. The record since 1990 shows consistent detection and recording of fish/non-fish storms in all categories. The record since 1852 shows increasing percentages of fish storms as expected (hurricanes and storms were more likely to be detected near land). However the strongest storms >= 125 knots show consistent recording over the full HURDAT period. The high percentage (about 85%) means that most of the strongest storms travel near land at some point. Also there is a consistent percentage in moderaely weak storms except an increase in the percentage of fish storms in the weakest category. All the long term plots show heavy clustering in 0, 50 and 100% indicating that small numbers (often just 1 or 2) of each category were recorded each season.
Code: stormsnearland.py | Data: hurdat.csv | Instructions: README
|
|
|
|